Loyalty Dollar Program
This is a Club Prophet Executive Report v4 – Power BI or PBI.
Note: Samples are using demo data and do not reflect real-world data.
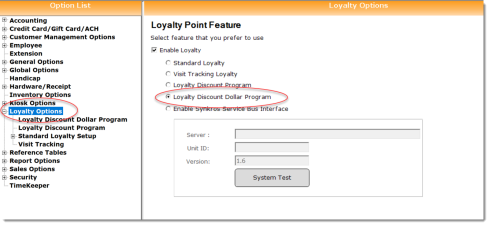
These reports are designed specifically for the Loyalty Discount Dollar Program. This is this selection in the Club Prophet Options screen for Loyalty Program:
You can find instructions for this Discount Dollar Loyalty Program here>>
Loyalty Discount Dollar Program - Category
Loyalty Discount Dollar Program – Category
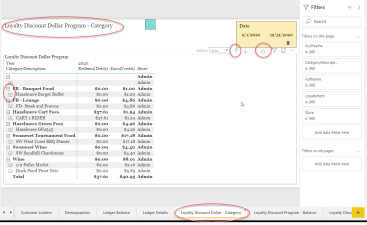
This report shows the Discounts Redeemed (Debits) and Discounts Earned (Credits) by Sale Category and product when using the Discount Dollar Program.
Note: There are several different Loyalty type programs and this report is specific to the Discount Dollar Program only.
This is a matrix type report where you get several options to Drill On both Rows and Columns. The different options will be discussed below.
Fields on the report include:
-
Columns:
-
Year – the Year (within the given date range) YYYY.
-
MonthYear – the Month and Year (within the given date range) MMMYYYY.
-
Date – the Date (within the given date range) MM/DD/YYYY.
-
-
Rows:
-
CategoryDescription – the description of the Sale Category where discount dollars were earned(credit) or redeemed(debit).
-
LoyaltyItem – the product description that resulted in a Debit or Credit to the Loyalty Discount Dollar ledger.
-
-
Values:
-
Full Name – Full Name of the customer who made the purchase.
-
Redeem(Debit) – The amount of Dollar Discount Redeemed (a Debit to the loyalty discount ledger).
-
Earn(Credit) – The amount of Dollar Discount Earned (a Credit to the loyalty discount ledger).
-
Store – Name of the store where the Dollar Discount transaction took place.
-
-
Totals
-
Row Totals will total the given row Values.
-
Column Totals will total the given columns.
-
Grand Total totals all values.
-
NAVIGATION
Matrix reports provide the ability to drill down on both Rows and Columns. There are three different ways to do this, depending on how you prefer to see the data. To see the menu on the right below, you need to either click the report area or hover your mouse over it.
-
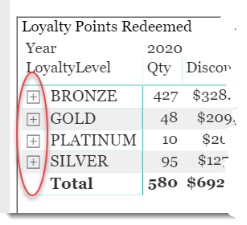
The Plus sign [+] next to Rows where you can expand to the lower levels for just that row of data; this is not available for columns.
-
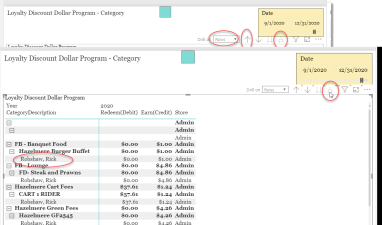
The Drill On drop-down allows you to select Rows or Columns.
-
The Double-Down Arrow will drill down one level for each click, changing the view of the data to the next level.
-
The Pitch Fork looking tool will drill down to the next level, but it will keep the top level on the screen and indent the lower level.
Note: to navigate back up thru the levels, use the single Up-Arrow (not circled).
-
The Single Down-Arrow, when turned on, lets you use your mouse to select given data points to drill down on. Feel free to try it.
Expand Rows and Columns using the + and - controls, drop-down and pitchfork
When you select or hover the mouse over the visual or the report area, you will see those circled controls in the top right.
-
Drill On – allows you to select Rows or Columns to drill up or down on.
-
Up Arrow – allows you drill up one level (if it is enabled)
-
Down Arrow – this will enable the report to be reactive to clicking on a single data point to drill down on.
-
Double Down Arrow – this will drill the entire report down one level.
-
Pitchfork Control – this will drill the entire report down one level while keeping the upper level on the report (Note: this is the default view of this report and the view shown above).
-
If you click through Columns, this is where YEAR is circled above. This will cycle down thru MMYYYY and MM/DD/YYYY.
-
Plus sign [+] will drill down one level on the given row.
-
Minus sign [-] will drill up one level on the given row.
FILTERS
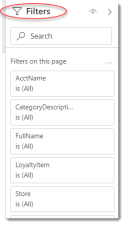
There are various Filters right hand sidebar you can use to narrow down the data.
Note these are the Page filters, if you select the visual which is to click the report, you will see additional filter options. There are basic and advanced filters for you to use. If you select an advanced filter, you need to click the apply filter link.
Tips
- Filters which are the gold back color controls on the report allow you to pick from a list. Hold down the Ctrl key on the keyboard to select multiple items.
- If you want to search for a particular value, use the filters in the right pane menu. They will have a search box in addition to a list of the items.
- Use the Advanced option in the right menu panel for advanced search options.
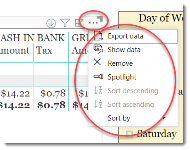
- Use the three dots […] in the top right of a visual for more options like Export data.
- Use the Help button to open the user guide for any given report
 .
.
